Lesson : How to use highs and lows in price
 How to use highs and lows in price
What are highs and lows in price, how does a trader find the trend? Look these concepts might seem strange and hard to find but when you think about it that should not be the case really.
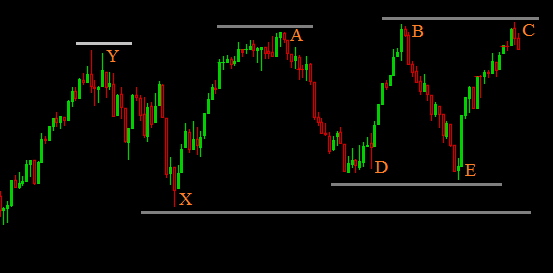
Now what do we see on this image? A series of highs and lows in price, this is what i aim to point out. Now to the novice it could be said that quite some more could be pointed out, but i did not.
Initial trend
Lets talk about trend. Assume that we do not have more information then what is on the image, although i do have this let's pretend that it is not available. Then up the point of Y we can notice that price has moved up, i might call this a long trend. But there is one problem, i do not know from where price has come before this. That is the problem. So if we only have price information up the Y point we cannot state which trend we have.
Now look at the chart again, price went down some to the point of X. It did chop around a bit also (and we cannot know this before it happens).. What is important with the X point is that price went there and then started to go up. At this point we do still do not know what the trend is because we do not know where price came from, albeit not enough.
The trend starter A
Now lets look at the chart again, look at A. price came from X this time, it has before come from a lower point and we do not know how much lower. It is important to know that A is higher then Y and price this time came from the low at X. At this time we can state that we know a trend, because we notice the low and recent high in price. I'd call this a long trend. But what do we do with it? Let's go on..
The trades D+E and B+C
Firstly lets talk about D, this point in price is close to X. In particular price is near the closing price of X, and a bit from the low of X. Now why is that important you may ask? Well because the low that was X created A and when price again comes to that point it should react similarly thus enforcing the trend or close below X invalidating the trend.
The point E is similar. Where i'd go long at D with stops under X, i would also go long at E with stops under D or X.
Lets talk about B+C. Price went up there to B, this level is close to A (nothing is exact in trading). While there are several price action signals on this chart, i will not cover there in this post. Now at B because it is similar to A it should be a good place to go short, is the current trend holds this would enforce it and if price goes further up it should invalidate it. That is the reason for going long at B, with stops above and also going short at C.
What i want to point out is a methodology where you as a trader thinks like this: "where did price go, and where did it ultimately come from before turning?". That is something that i do in my trading, i mark these areas, they later become levels of interest and something that might be useful later on. I could go on with more examples but i'll leave this to sink in for now. Send your questions here if you have them.
Lesson : How to use highs and lows in price
![Lesson : How to use highs and lows in price]() بواسطة ايمن المقطري
في
سبتمبر 20, 2015
تقييم:
بواسطة ايمن المقطري
في
سبتمبر 20, 2015
تقييم:


ليست هناك تعليقات: